What Are You Counting?
Two matches, one university. Which number should the report use?
Start here if you can explain one row of the campus match table. Review shared names.
Sections in this chapter
1. Read the report question
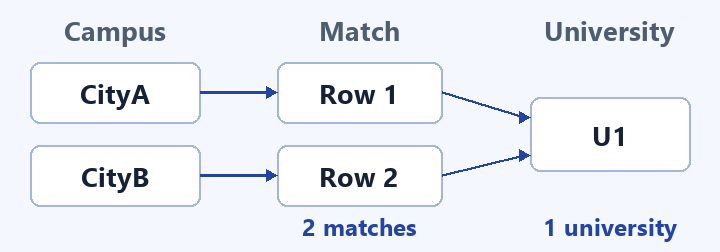
A campus report contains two rows for Alice’s university. One follows the route to CityA. The other follows the route to CityB. The university cell says U1 in both. You can report two campus matches or one university using exactly the same evidence.
Imagine a reader uses the report to plan visits. The two matched campuses give that reader two destinations to consider. A colleague who is preparing an index of universities needs a single entry for U1. People can make different decisions from the same table because the two reports ask about different things.
One contribution from each complete match.
One contribution from each different university.
Read each question out loud and finish the sentence “One contribution comes from each …”. The first question ends with “complete match”. The second ends with “different university”. Giving the number a unit makes it possible to check whether the query reports what the reader asked for.
In our example, a match is a way to fill in the university and city together while following the study and campus facts. A university is one of the things that can fill a cell. One university can fill that cell in several matches. The two words describe different parts of the table.
Words like “different” and “distinct” tell you to check for repeated values, but the noun matters just as much. “Different campuses” asks you to compare campus values. “Different universities” asks you to compare university values. A title such as “Total” gives the reader neither the unit nor the rule.
The campus example uses simple labels, so you can work out the result by looking. A real query may return a large table. The same habit still applies. Decide what one contribution represents, inspect the columns that identify it, and then choose how to count.
Our worked report starts with the shared university match you built in the previous chapter. The next step is to keep the complete matches in view so you can check which evidence supports each number.
2. Find the evidence for each row
Start with the question about campus matches. Alice’s study arrow leads to U1. From U1 the campus relationship leads to CityA and to CityB. Following either route supplies the two facts needed for a row. The city is the only value that changes between the routes.
We will call the CityA match Row 1 and the CityB match Row 2. These labels help you track the example through several views. The row labels sit alongside the results as reading aids. The query’s values are the university and city.
Read the Row 1 cells back into a sentence. Alice studies at U1, and U1 has a campus in CityA. Repeat the same check with Row 2. Alice still studies at U1, and this time U1 has a campus in CityB. Each row gives you a complete route you can verify.
Notice which work is shared. Both rows use the same fact about where Alice studies. Each row then uses a different campus fact. A result row can share part of its evidence with another row. Each supported way of filling the blanks is still a complete match.
What does Row 2 add?
Row 2 adds the campus match for CityB. Its university is still U1. The new evidence is the campus edge to CityB.
The campus graph includes another university, U2, with a campus in CityC. U2 has a campus edge, but the university shared by the study and campus conditions has to be U1. CityC therefore has no row in this table. The numbers later in the chapter describe the rows that passed that earlier test.
This check matters when you review a report. You can count a table accurately even if the table came from a poor match. First inspect the relationship that puts each row there. Once you trust that part, work on how to display or count the values that are present.
Both matched routes remain available as evidence in the graph. The result table is a view of the matches. In the next view, we keep the university values visible so the report can focus on its second question.
Suppose a reviewer asks which facts justify the number two. You can point to the same study fact in both routes and to a different campus fact in each. A useful answer names these facts and says which role each plays. The table lets you make that check row by row.
3. Keep only the University column
Imagine copying each row to a new sheet while leaving the city cell behind. From Row 1 you copy U1. From Row 2 you also copy U1. The new sheet has one column and two entries. That is what happens when you select University from these matches.
Choosing which columns form the output is called projection. Here SELECT ?university is the instruction to keep the university value. The city can still be used to find the matches even though its value will be absent from the printed result.
Try a quick count. If you cover the city column with paper, how many rows are left? Check that you have accounted for both evidence rows before unfolding the answer.
Show the rows after projection
There are two rows. The projection keeps U1 from Row 1 and U1 from Row 2. Only the city cell disappears from each printed row.
| University |
|---|
| U1 |
| U1 |
Compare the two views cell by cell. In the complete table you could identify the CityB match by reading the city cell. In this view you can still see the space occupied by that result, but its printed value looks the same as the result above it. Projection changes what you can tell apart by looking.
It can help to think of projection as an instruction to a report writer. For every matched route, write down only the values that belong under the requested headings. If two routes suggest the same entry, the instruction is still to write one entry per route. You need a further rule to keep one copy.
This distinction also tells you what to do when a report looks suspiciously repetitive. Go back to the full matches and show the evidence columns. When the hidden cities are visible again, you can see that the two reports of U1 came from different supported campus facts.
This is how repeated cells can appear even when each fact is recorded once. The two graph statements about campuses have different city objects. Selecting just a university value from each supported match puts the same value on the page twice. The repetition belongs to the result of the selection.
Row 1 and Row 2 only identify positions in the teaching example and stay outside the result columns. SPARQL can present the matches in a different order. Both orders have the same values, occurrences, and totals.
4. Keep one copy of each different row
Now suppose the report is a list of university names. Two identical printed values are unnecessary for that purpose. Adding DISTINCT to the one-column selection keeps one row for each different printed university value. In this example the result can be printed as a single line.
| University |
|---|
| U1 |
Hold that view beside the one you just predicted. In View 2, each complete match produced its own entry in the single University column. In View 3, the entries were compared and the repeated one was removed. Seeing one line in the final list is consistent with still having two original campus matches.
SELECT DISTINCT compares the combination of all the selected columns in each output row. Here the selection contained only University, which made the two entries equal. If City is selected too, the two printed rows differ. The same keyword can therefore leave a different number of rows when the selection changes.
| University | Campus city |
|---|---|
| U1 | CityA |
| U1 | CityB |
Look at the comparison table and find where equality stops. The first cells both say U1. The next cells say CityA and CityB. The selected pairs differ at that position. To decide whether two printed rows collapse, check every column that participates in the output you asked for.
Consider a different university opening a campus in CityA. The city cell for two matches might now both say CityA. If both University and City are selected, different university values still keep the pairs separate. Equality depends on the selected values, so two rows can agree in either column and remain different as pairs.
Deduplicating the output keeps the original facts available for inspection. You can still ask which campus matches supported U1, and recover both by looking back at the first table. Use the single row for the distinct university list and the full rows when evidence about each campus matters.
Ask two questions in order. Which values did I choose to print? Which printed rows are equal in every selected column? Once you can answer both, you can explain what the smaller list represents.
5. Choose the expression that fits
Return to the opening questions. For the campus-match report, every match has a filled University cell. Two filled cells contribute two to the count. For the distinct university report, only one value occurs in that column. U1 contributes one even though it was printed twice before duplicate rows were removed.
| What the report asks for | Expression | Result |
|---|---|---|
| A university value for each campus match | COUNT(?university) | 2 |
| Each different university once | COUNT(DISTINCT ?university) | 1 |
COUNT(?university) counts the filled university values in the matches. In our example, the same value can contribute once for CityA and again for CityB. Every row here has a university, so the number of filled values equals the number of rows.
COUNT(DISTINCT ?university) first considers the different filled values of that variable. U1 occurs twice, but there is only one different value to count. CityA and CityB explain why there were two matches in the first place. The count is about the university values, so the cities do not contribute separately.
You can verify both figures using the page above. Point to the two U1 entries in the projection view for the ordinary count. Point to the single U1 entry in the distinct list for the other count. You are tying the arithmetic back to evidence a reader can check.
The reports can be written clearly as “2 matches, covering 1 different university.” This sentence identifies both units and lets a reader see why the numbers belong together. A single figure without a unit gives a reader fewer clues about how you reached the answer.
Suppose the question changes to “How many different campus cities appear?” The useful column would then be City. Selecting a suitable count starts with the object the question names, followed by the rule for repeated values of that object.
When you read a count expression, find the variable inside the parentheses and point to the column it refers to. Next ask whether DISTINCT restricts what can contribute. This works even if you have never read the rest of the query before.
Each of the complete count queries below prints a single cell named ?n. That cell is a summary of the matches, and its value can be two even though the report prints one row. Return to the evidence table when you want to see the contributions that were counted.
Choose the unit before choosing the expression. The names printed in the expression tell you which values the query is counting.
Read the complete count queries
PREFIX ex: <https://example.org/>
SELECT (COUNT(?university) AS ?n) WHERE {
  ex:Alice ex:studiedAt ?university .
  ?university ex:hasCampusIn ?city .
}
PREFIX ex: <https://example.org/>
SELECT (COUNT(DISTINCT ?university) AS ?n) WHERE {
ex:Alice ex:studiedAt ?university .
?university ex:hasCampusIn ?city .
}6. Predict the effect of a new record
A new campus opens in CityD. U1 gains an edge to CityD and keeps its previous campus edges. Alice’s study fact also stays the same. Predict one consequence for the campus-match report and one for the distinct university report before comparing the two tables.
Work from the graph rather than from the totals. The new edge gives another way to complete the campus condition while the shared university remains U1. You can write the new complete match as U1 with CityD. That is the evidence for adding one to the first total.
Moving from the complete table to the University column gives you three entries, all named U1. Use your answer to the second report’s question as a check. Did the new entry introduce a different university value? If you can explain that step, you can explain why the two totals changed differently.
| Case | Campus matches | Different universities |
|---|---|---|
| CityA and CityB | 2 | 1 |
| Also CityD | 3 | 1 |
It can be useful to practise the reverse prediction too. If the CityD edge is removed, the campus condition loses that match, but the University column still contains U1 in the remaining rows. Both operations can be explained by following the evidence in and out of a single row.
The test has two small parts. First verify which matches the changed graph can support. Then inspect the column that each count uses. Keeping these questions separate makes the arithmetic easier to check, especially when more than one repeated value appears.
In a larger report, a conspicuously small distinct count can prompt you to inspect the full match table. It may simply reflect several sound matches for the same thing. It can also hide a match that used the wrong relationship. The number by itself gives limited information about which case you have.
The next chapter uses that idea to compare two queries whose printed answers agree on the original data. For now, practise giving the unit for each number, then use a fresh registration report to check that you can apply the same approach to a different table.
Check projection and counting
Need a reminder? Follow the table as it loses a column before deciding what to count.
Use the two campus matches to check your understanding before moving on to the club report. Give each number a unit when you say it aloud. Compare the unit “rows on the page” with “different universities” and work out which one belongs in each question.
For the first question, keep track of the two source rows. CityA and CityB still explain where those rows came from. Decide what you would write under University if each complete match gave you one opportunity to copy a cell.
If you chose one row, compare your answer with the projection example. Follow each campus match through the copying step. A separate instruction to keep different values is the step that eventually leaves a single row in a list.
Next, compare the university values, using the projected table when it becomes visible. Underline each value that adds a new university to your tally. Each campus can still contribute to the match count even when its university is already in that tally.
If you chose two different universities, go back to the two entries and read the university in each. The cities account for two matches, and both rows name U1. Try the count again with the university values in view.
Check how to report the two numbers
A short report could say “Alice’s university has two campus matches in this graph. Those matches involve one different university.” The first sentence refers to two supported paths and the second refers to a single university value shared by those paths.
Keep the unit beside the number when you give your own answer. If someone asks why two numbers came from the same table, point to each city in the full table and each different value in the University column.
Check a club registration report
A school has a record for each student who registered for a club. Amina registered for Chess and Gardening. Theo registered for Chess. The head of the school wants to know how many registration records exist and how many different students appear in them.
| Student | Club |
|---|---|
| Amina | Chess |
| Amina | Gardening |
| Theo | Chess |
- Give the two numbers the school needs. Name the unit for each number.
- Suppose Amina registers for Robotics as well. Predict both new totals.
- Explain why the additional registration affects the two totals in different ways.
Try saying your explanation in one sentence before opening the answer. You can start with “The new record adds …” and finish by saying whether its student value is already present. Your explanation should make sense to someone who has only seen the registration table.
Get a hint
Find all the records with Amina in the Student column. Count the contributions these records make to the registration total first. Next ask what would go on a list of the different students who registered.
In the second case the school receives a new row with two cells. Read both cells and check whether the student cell adds a new name to that list.
Check the two totals and the new row
The original table has 3 registration records and 2 different students. Every record contributes to the first total. Selecting only Student leaves Amina, Amina and Theo, and the different values in that column are Amina and Theo.
| Student | Club |
|---|---|
| Amina | Chess |
| Amina | Gardening |
| Theo | Chess |
| Amina | Robotics (new) |
After the change there are 4 registration records and 2 different students. The new club gives Amina a new registration. The student in that row still contributes to the same entry on the list of students.
A model explanation is “Robotics adds a registration for Amina, who is already included in the distinct student count.” Check that your explanation names both the new record and the existing student. Those two pieces of evidence account for both results.
If you counted three students at first, trace the first two rows back to their Student cells. If you predicted three students after the change, compare Amina’s new row with her earlier ones. In each case, the repeated student value is the reason the student total is lower than the number of records.
One more check for your report. Chess appears twice because two students registered for it. A question about different clubs would use the Club column. The head of the school asked about students, so compare values from the Student column when explaining the answer.
Review the two counting expressions if you want to connect your explanation back to the query. When you are ready, continue to the next chapter to check how a short answer can hide an incorrect match.
Ready to move on?
Explain why one table can contain two matching rows and one different university. Say which number the question asks for.